Research
JEM-GLIMS Mission
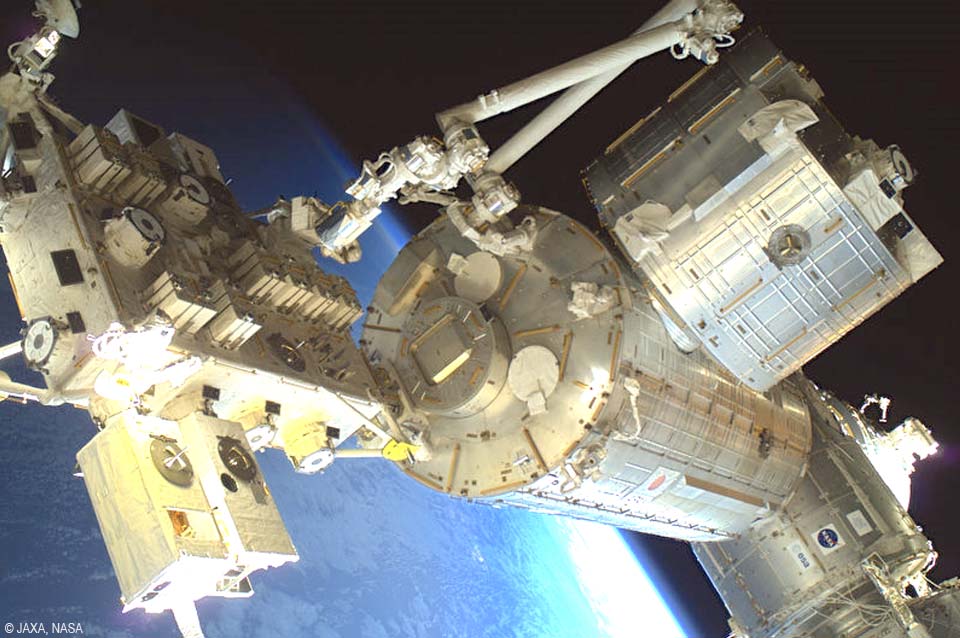 We conducted the space observations of lightning discharges and lightning-associated transient luminous events (TLEs), such as sprites, elves, blue jets,
from the Exposed Facility (EF), Japanese Experimeent Module (JEM), the International Space Station (ISS), which is named as JEM-GLIMS
(Global Lightning and sprIte MeasurementS on JEM-EF) mission. The most unique point of this mission is to observe the lightning and TLE emissions
in the nadir direction from the 400 km orbital altitude of the ISS. Thus, it can easily measure the
horizontal distribution of sprites, which is relatively difficult from the ground-based observations. The JEM-GLIMS instruments, which was
developed by the researchers in Hokkaido Univ., Osaka Univ., Kindai Univ., and JAXA, was launched by the H-IIB rocket from the Tanegashima Space Center on
July 21, 2012, and we started the continuous measurement in December 2012. All of the JEM-GLIMS observations were finished in August, 2015.
We conducted the space observations of lightning discharges and lightning-associated transient luminous events (TLEs), such as sprites, elves, blue jets,
from the Exposed Facility (EF), Japanese Experimeent Module (JEM), the International Space Station (ISS), which is named as JEM-GLIMS
(Global Lightning and sprIte MeasurementS on JEM-EF) mission. The most unique point of this mission is to observe the lightning and TLE emissions
in the nadir direction from the 400 km orbital altitude of the ISS. Thus, it can easily measure the
horizontal distribution of sprites, which is relatively difficult from the ground-based observations. The JEM-GLIMS instruments, which was
developed by the researchers in Hokkaido Univ., Osaka Univ., Kindai Univ., and JAXA, was launched by the H-IIB rocket from the Tanegashima Space Center on
July 21, 2012, and we started the continuous measurement in December 2012. All of the JEM-GLIMS observations were finished in August, 2015.
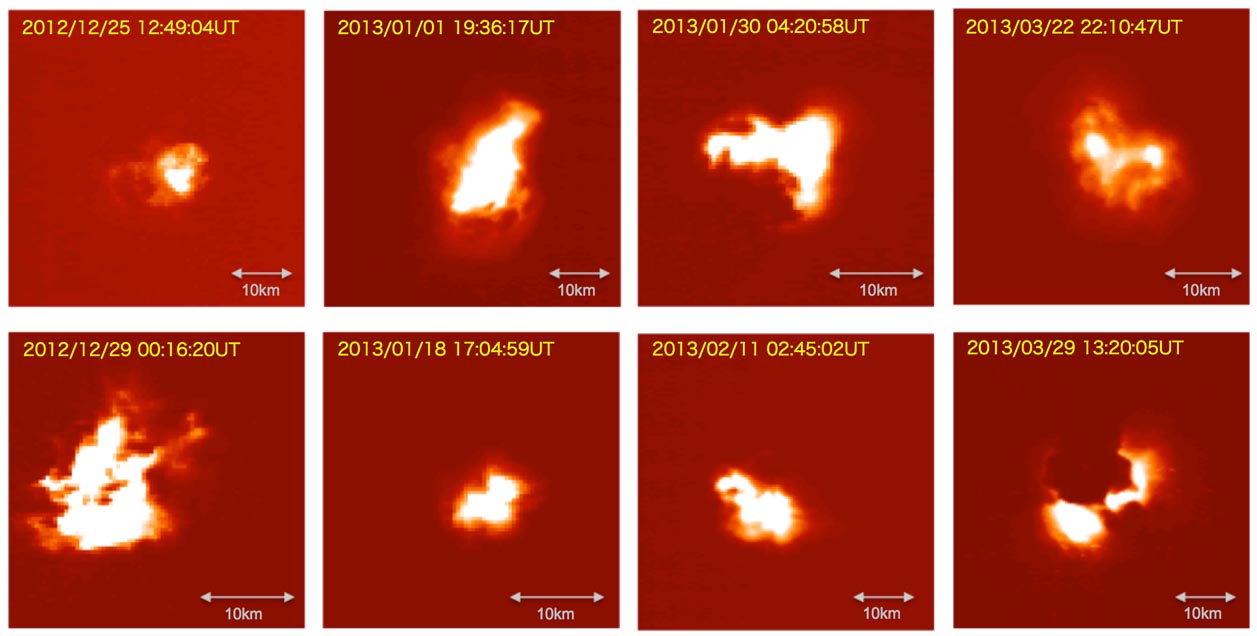 During the observation period of 2 years and 8 months, JEM-GLIMS detected 8,357 lightning events including 699 TLEs. From the
detailed comparison between the JEM-GLIMS data and the ground-based lightning data (NLDN, JLDN, WWLLN, GEON), 42 and 508 events were
identified as sprites and elves, respectively. Right figure shows the lightning optical emissions detected by the CMOS camera (LSI:
Lightning and Sprite Imager). The typical horizontal scale size of the lightning emissions was found to be ~20 km. But, the shape of the lightning emissions
are not simple but complicated. This complexity may be originated in the altitude difference of the source lightning current in the thundercloud. At the
right-bottom panel in this figure, the lightning emission seems to be masked by another patchy cloud over the thundercloud.
During the observation period of 2 years and 8 months, JEM-GLIMS detected 8,357 lightning events including 699 TLEs. From the
detailed comparison between the JEM-GLIMS data and the ground-based lightning data (NLDN, JLDN, WWLLN, GEON), 42 and 508 events were
identified as sprites and elves, respectively. Right figure shows the lightning optical emissions detected by the CMOS camera (LSI:
Lightning and Sprite Imager). The typical horizontal scale size of the lightning emissions was found to be ~20 km. But, the shape of the lightning emissions
are not simple but complicated. This complexity may be originated in the altitude difference of the source lightning current in the thundercloud. At the
right-bottom panel in this figure, the lightning emission seems to be masked by another patchy cloud over the thundercloud.
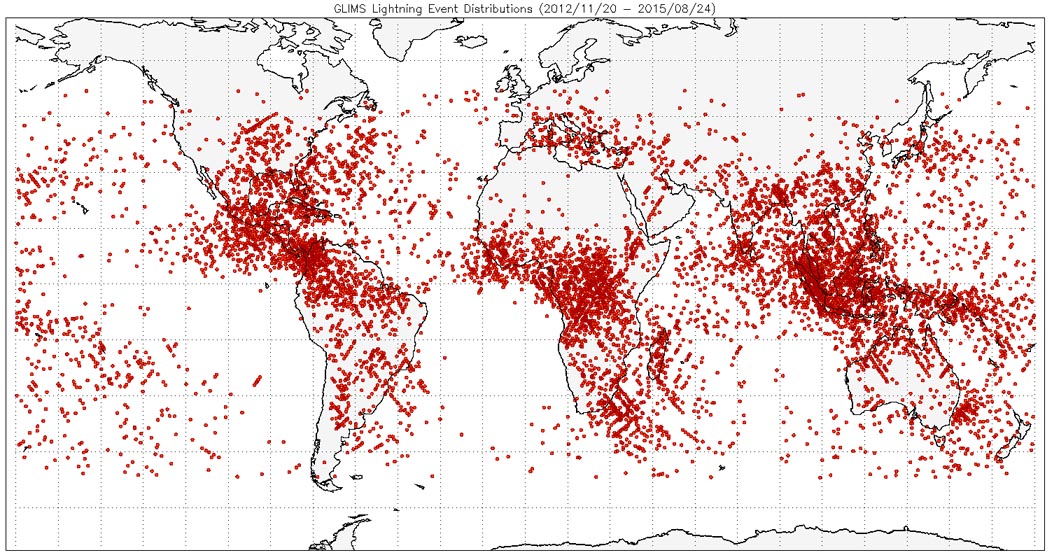 Left figure shows the global distribution of lightning discharges detected by JEM-GLIMS in the period from Dec. 2012 to Aug. 2015. From this
figure, it is clear that the lightning discharges mainly occurred in North and South America, Africa, and South-east Asia. This global lightning distribution
derived from the JEM-GLIMS observations is comparable to that derived from (OTD
(Optical Transient Detector) and TRMM/LIS (Lightning Imaging Sensor)
observations. In addition, we can see some lightning activities over the See of Japan and the Mediterranean Sea. These lightning discharges might be related
to the winter lightning. From this result, we can estimate the global occurrence rate of lightning discharges and TLEs. As the
orbital inclination of the ISS is 51o, JEM-GLIMS can measure lightning discharges in the wider local time (LT) ranges. Thus, we can first estimate
the LT dependences of the TLE occurrence rate !!
Left figure shows the global distribution of lightning discharges detected by JEM-GLIMS in the period from Dec. 2012 to Aug. 2015. From this
figure, it is clear that the lightning discharges mainly occurred in North and South America, Africa, and South-east Asia. This global lightning distribution
derived from the JEM-GLIMS observations is comparable to that derived from (OTD
(Optical Transient Detector) and TRMM/LIS (Lightning Imaging Sensor)
observations. In addition, we can see some lightning activities over the See of Japan and the Mediterranean Sea. These lightning discharges might be related
to the winter lightning. From this result, we can estimate the global occurrence rate of lightning discharges and TLEs. As the
orbital inclination of the ISS is 51o, JEM-GLIMS can measure lightning discharges in the wider local time (LT) ranges. Thus, we can first estimate
the LT dependences of the TLE occurrence rate !!
![]() Right figure is the movie of the lightning and sprite emissions detected at 06:41:15UT on June 12, 2014 over Kanzas, USA. Lighting and sprite
emissions are indicated by the rainbow and red color, respectively. In the first frame (frame-1), only the lightning emission was detected. 34 ms later
(framee-2), the sprite emission was also detected. In the frame-3 and framee-4, the sprite emission remained in the same position though thee lightning
emission was disappeared. It is important that the sprite occurred above the lightning discharge with the horizontal shift. In the
case shown in the right figure, there was the horizontal displacement of ~10 km. This fact does not agree with the conventional generation mechanism of sprites,
such as QE model (Quasi-Electrostatic Model). There must be some other factors producing this spatial displacement. Our final goal is to clarify the reason of
the horizontal displacement of sprites.
Right figure is the movie of the lightning and sprite emissions detected at 06:41:15UT on June 12, 2014 over Kanzas, USA. Lighting and sprite
emissions are indicated by the rainbow and red color, respectively. In the first frame (frame-1), only the lightning emission was detected. 34 ms later
(framee-2), the sprite emission was also detected. In the frame-3 and framee-4, the sprite emission remained in the same position though thee lightning
emission was disappeared. It is important that the sprite occurred above the lightning discharge with the horizontal shift. In the
case shown in the right figure, there was the horizontal displacement of ~10 km. This fact does not agree with the conventional generation mechanism of sprites,
such as QE model (Quasi-Electrostatic Model). There must be some other factors producing this spatial displacement. Our final goal is to clarify the reason of
the horizontal displacement of sprites.
In our laboratory, we are conducting the following research topics using JEM-GLIMS data:
More details about this mission: click here
TARANIS Mission,ASIM Mission
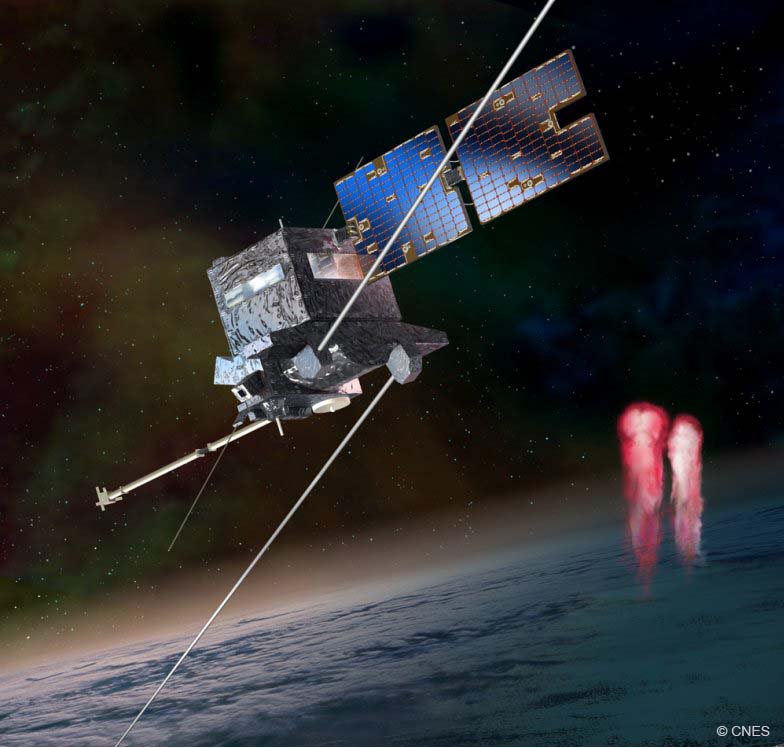 The TARANIS (Tool for the Analysis of RAdiation from lightNIng and Sprites) microsatellite mission will conduct the nadir observations of lightning, TLEs (TLEs :
Transient Luminous Events) and TGFs (TGFs : Terrestrial Gamma-ray Flashes) from the 700 km orbital altitude (left figure). This microsatellite is developed
by the French space agency (CNES: Centre National d'Etudes Spatiales) and will be launched in the early 2020, and many lightning/TLEs/TGFs
researchers in EU join this mission. The main objectives of this mission are almost same as the JEM-GLIMS mission and are (1) to identify the horizontal
distribution of sprites, (2) to identify the generation mechanism of sprites, (3) to identify the characteristics of lightning discharges producing TGFs, and (4) to
identify the generation mechanism of TGFs. Two optical instruments (cameras and photometers), an electron particle detector, three gamma-ray/X-ray detectors,
electromagnetic wave detectors are on board the TARANIS satellite. The members in my lab, joined this mission since 2006 and are in charge of
the development of the photometers.
The TARANIS (Tool for the Analysis of RAdiation from lightNIng and Sprites) microsatellite mission will conduct the nadir observations of lightning, TLEs (TLEs :
Transient Luminous Events) and TGFs (TGFs : Terrestrial Gamma-ray Flashes) from the 700 km orbital altitude (left figure). This microsatellite is developed
by the French space agency (CNES: Centre National d'Etudes Spatiales) and will be launched in the early 2020, and many lightning/TLEs/TGFs
researchers in EU join this mission. The main objectives of this mission are almost same as the JEM-GLIMS mission and are (1) to identify the horizontal
distribution of sprites, (2) to identify the generation mechanism of sprites, (3) to identify the characteristics of lightning discharges producing TGFs, and (4) to
identify the generation mechanism of TGFs. Two optical instruments (cameras and photometers), an electron particle detector, three gamma-ray/X-ray detectors,
electromagnetic wave detectors are on board the TARANIS satellite. The members in my lab, joined this mission since 2006 and are in charge of
the development of the photometers.
More details about this mission: click here
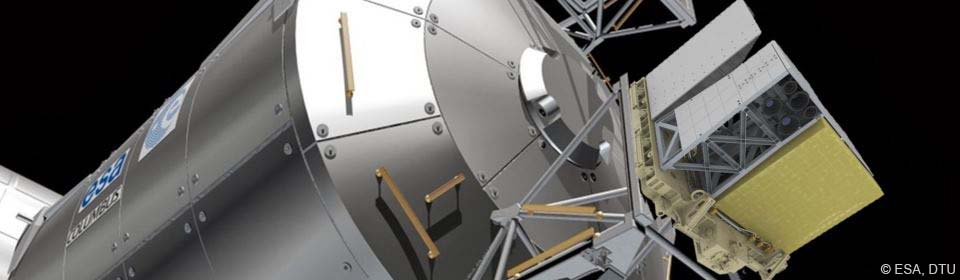 In addition, ESA (European Space Agency) is also conducting the space mission, named as ASIM (Atmosphere-Space Interactions Monitor), to observe lightning, TLEs and
TGFs from the Columbus Module, International Space Station (ISS) (right figure). The science objectives of the AISM mission are almost same as those of the
TARANIS mission. ASIM was launched by Falcon-9/Dragon in Apr. 2, 2018. ASIM also equips the optical sensors (cameras and photometers) and
a gamma-ray detector. The members in my lab joins this mission as one of science collaborators by feedbacking the knowledge derived from the JEM-GLIMS
mission.
In addition, ESA (European Space Agency) is also conducting the space mission, named as ASIM (Atmosphere-Space Interactions Monitor), to observe lightning, TLEs and
TGFs from the Columbus Module, International Space Station (ISS) (right figure). The science objectives of the AISM mission are almost same as those of the
TARANIS mission. ASIM was launched by Falcon-9/Dragon in Apr. 2, 2018. ASIM also equips the optical sensors (cameras and photometers) and
a gamma-ray detector. The members in my lab joins this mission as one of science collaborators by feedbacking the knowledge derived from the JEM-GLIMS
mission.
More details about this mission: click here
AKATSUKI Mission : Venus Orbitor
 Venus has the 243 Earth-days rotation period. On the other hand, the upper atmosphere of Venus over the 60 km altitude has 4 Earth-days rotation period. If this
situation occurs in the Earth, the atmosphere at 10 km altitude rotates around the Earth with 24 minutes (the velocity of the atmosphere in the equator corresponds to
28 km/s, which is the speed traveling from Tokyo to Yokohama with 1 sec!!). This super-high motion of the atmosphere is called as "super rotation".
In order to solve the generation mechanism of the super rotation, AKATSUKI spacecraft was launched in 2010, developed by ISAS/JAXA. This
spacecraft equips 5 different cameras: (1) the ultraviolet camera (UVI), (2) the near infrared 1-μm camera (IR1), (3) the near infrared 2-μm camera (IR2),
(4) the longwave infrared camera (LIR), and (5) the lightning and airglow camera (LAC). The members in our laboratory were in charge of the development of 3 of 5 cameras (i.e.,
UVI, LIR, LAC). Especially, we are the lead investigators of the LAC operation and data analysis.
Venus has the 243 Earth-days rotation period. On the other hand, the upper atmosphere of Venus over the 60 km altitude has 4 Earth-days rotation period. If this
situation occurs in the Earth, the atmosphere at 10 km altitude rotates around the Earth with 24 minutes (the velocity of the atmosphere in the equator corresponds to
28 km/s, which is the speed traveling from Tokyo to Yokohama with 1 sec!!). This super-high motion of the atmosphere is called as "super rotation".
In order to solve the generation mechanism of the super rotation, AKATSUKI spacecraft was launched in 2010, developed by ISAS/JAXA. This
spacecraft equips 5 different cameras: (1) the ultraviolet camera (UVI), (2) the near infrared 1-μm camera (IR1), (3) the near infrared 2-μm camera (IR2),
(4) the longwave infrared camera (LIR), and (5) the lightning and airglow camera (LAC). The members in our laboratory were in charge of the development of 3 of 5 cameras (i.e.,
UVI, LIR, LAC). Especially, we are the lead investigators of the LAC operation and data analysis.
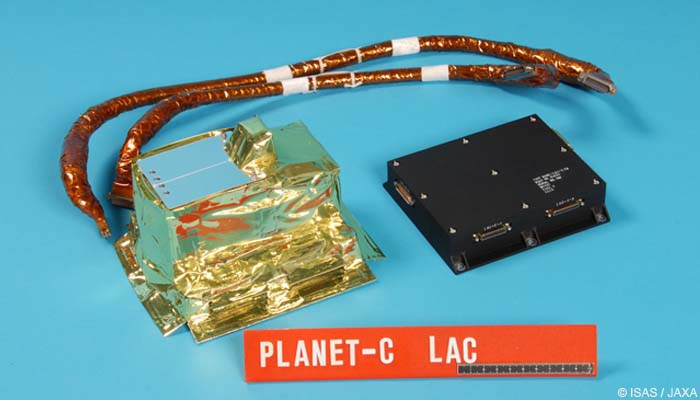 One of the unsolved problems in the Venus atmospheric physics is the existence of lightning discharges in the Venus atmosphere. As there is the
dense cloud at the 60 km altitude, it is suggested that there must be lightning discharges in that cloud layer. Although many ground-based and space-borne observations had
been carried out so far, the final answer to this question is not yet obtained. In order to solve this problem, LAC is on board thee AKATSUKI space craft. LAC can measure
the time variation of the absolute optical intensities with the time resolution of 32 μs. This kind of lightning measurements has not been performed in Venus so far.
If LAC succeed in detecting the Venusian lightning emissions, it will be the world first result. Now, we are conducting the LAC observations and intensive data analysis. We
hope we can solve this problem using the LAC data.
One of the unsolved problems in the Venus atmospheric physics is the existence of lightning discharges in the Venus atmosphere. As there is the
dense cloud at the 60 km altitude, it is suggested that there must be lightning discharges in that cloud layer. Although many ground-based and space-borne observations had
been carried out so far, the final answer to this question is not yet obtained. In order to solve this problem, LAC is on board thee AKATSUKI space craft. LAC can measure
the time variation of the absolute optical intensities with the time resolution of 32 μs. This kind of lightning measurements has not been performed in Venus so far.
If LAC succeed in detecting the Venusian lightning emissions, it will be the world first result. Now, we are conducting the LAC observations and intensive data analysis. We
hope we can solve this problem using the LAC data.
More details about this mission: click here
JUICE Mission
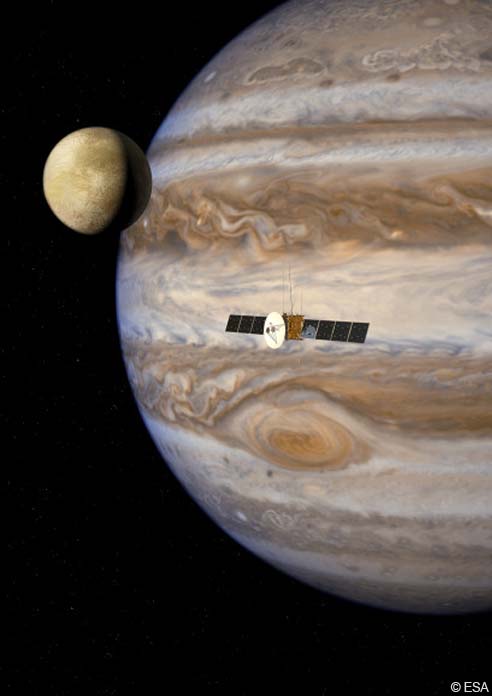 The main objective of the JUICE (Jupiter Icy Moons Explorer) mission is to explore Jupiter and three of its icy moons, Ganymede, Europa, and Callisto. The JUICE spacecraft
will observe these three Jupiter's icy moons in detail and will clarify the surface tectonics, existence of the internal ocean and the potential habitability of icy worlds.
In addition, it will observe the Jupiter's atmosphere and magnetospheric plasma and will identify the relation between the Jupiter and its icy moons.
The main objective of the JUICE (Jupiter Icy Moons Explorer) mission is to explore Jupiter and three of its icy moons, Ganymede, Europa, and Callisto. The JUICE spacecraft
will observe these three Jupiter's icy moons in detail and will clarify the surface tectonics, existence of the internal ocean and the potential habitability of icy worlds.
In addition, it will observe the Jupiter's atmosphere and magnetospheric plasma and will identify the relation between the Jupiter and its icy moons.
The JUICE spacecraft is now developed by ESA and will be launched in 2022. This spacecraft finally arrive at Jupiter in 2030!! The instruments on
board this spacecraft are mainly developed by European research teams, but Japanese research teams also join this activity.
 The member in this laboratory joins the development of visible camera (JANUS : Jovis, Amorum ac Natorum Undique Scrutator) as co-investigators and are making the plan to observe
Jovian lightning using JANUS.
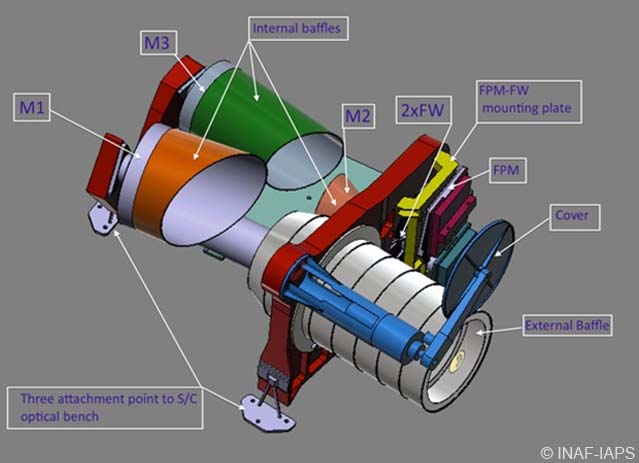
Right figure shows the schematic illustration of the JANUS structure. This camera equips the filter wheel containing the 13 band-pass filters and can change the
filter according to the observation target. In the Jovian atmosphere, lighting has a strong emission line at the Balmer α line (656.3 nm), and JANUS equips the band-pass
filter with the center wavelength of the Balmer α line. From the optical observations of Jovian lightning, we can deduce the
vertical convection structure in the Jovian atmosphere. This will help to clarify the generation mechanism of the stripe structure (zone and belt) of
the Jovian atmosphere.
The member in this laboratory joins the development of visible camera (JANUS : Jovis, Amorum ac Natorum Undique Scrutator) as co-investigators and are making the plan to observe
Jovian lightning using JANUS.
Right figure shows the schematic illustration of the JANUS structure. This camera equips the filter wheel containing the 13 band-pass filters and can change the
filter according to the observation target. In the Jovian atmosphere, lighting has a strong emission line at the Balmer α line (656.3 nm), and JANUS equips the band-pass
filter with the center wavelength of the Balmer α line. From the optical observations of Jovian lightning, we can deduce the
vertical convection structure in the Jovian atmosphere. This will help to clarify the generation mechanism of the stripe structure (zone and belt) of
the Jovian atmosphere.
More details about this mission: click here
Observations of Electromagnetic Waves in the ELF/VLF Range
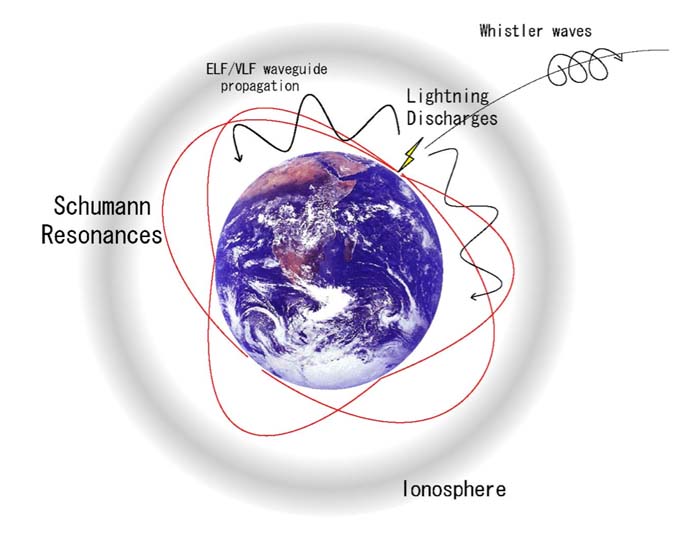 Lightning discharges can excite strong electromagnetic waves in the frequency range from a few Hz to a few hundreds of MHz. The lightning-excited electromagnetic waves in the ELF
(<3 kHz) and VLF (3-30 kHz) ranges can propagate long distances within the Earth-ionosphere wave guide (left figure). Especially, the lightning-excited electromagnetic
waves in the frequency range of 8-60 Hz is called as Schumann Resonance (SR). As the wavelength of SR waves is quite long as indicated by the red lines in the left figure
and as the attenuation rate of SR waves is quite low (<0.3 dB/Mm), SR waves can propagate long distance. Generally, lightning discharges occur with the rate of 50 flash/s in the world.
So, SR waves are always excited by the global lightning discharges in this waveguide. Thus, the spectrum of SR waves shows the harmonic structure peaked at 8 Hz, 14 Hz, 20 Hz, 26 Hz, etc.
From the measurement of SR waves at a few sites in the world, we can monitor global lightning activities.
Lightning discharges can excite strong electromagnetic waves in the frequency range from a few Hz to a few hundreds of MHz. The lightning-excited electromagnetic waves in the ELF
(<3 kHz) and VLF (3-30 kHz) ranges can propagate long distances within the Earth-ionosphere wave guide (left figure). Especially, the lightning-excited electromagnetic
waves in the frequency range of 8-60 Hz is called as Schumann Resonance (SR). As the wavelength of SR waves is quite long as indicated by the red lines in the left figure
and as the attenuation rate of SR waves is quite low (<0.3 dB/Mm), SR waves can propagate long distance. Generally, lightning discharges occur with the rate of 50 flash/s in the world.
So, SR waves are always excited by the global lightning discharges in this waveguide. Thus, the spectrum of SR waves shows the harmonic structure peaked at 8 Hz, 14 Hz, 20 Hz, 26 Hz, etc.
From the measurement of SR waves at a few sites in the world, we can monitor global lightning activities.
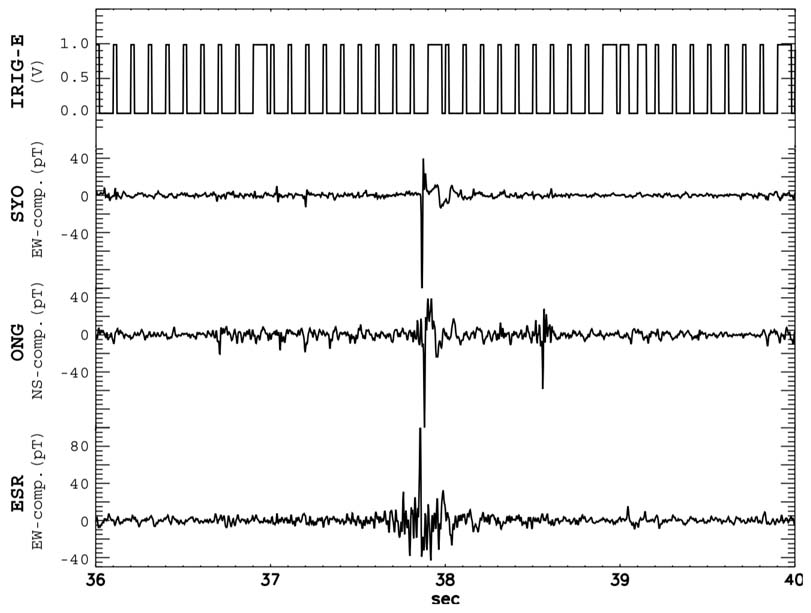 Our laboratory developed the 1-100 Hz ELF observation system in 1998 in order to continuously monitor SR waves. We installed this observation system in Syowa
station in Antarctica (Feb., 2000), Kiruna in Sweden (Aug., 2003), Onagawa in Japan (June, 2001), and Kuju in Japan (June 2013) and continue the waveform data acquisition. Right
figure shows an example of the transient SR waves simultaneously observed at Syowa, Kiruna, and Onagawa. As this transient SR wave was simultaneously detected at different sites,
the lightning discharges exciting this wave is deduced to be intense having large charge moment change. From the difference of wave arrival time at these stations and direction of wave
arrival, it is possible to estimate the lightning location exciting this wave. As the intense lightning discharges can excite transient luminous events (TLEs),
such as sprites, elves, blue jets, it is possible to monitor global TLE activities by monitoring SR waves.
Our laboratory developed the 1-100 Hz ELF observation system in 1998 in order to continuously monitor SR waves. We installed this observation system in Syowa
station in Antarctica (Feb., 2000), Kiruna in Sweden (Aug., 2003), Onagawa in Japan (June, 2001), and Kuju in Japan (June 2013) and continue the waveform data acquisition. Right
figure shows an example of the transient SR waves simultaneously observed at Syowa, Kiruna, and Onagawa. As this transient SR wave was simultaneously detected at different sites,
the lightning discharges exciting this wave is deduced to be intense having large charge moment change. From the difference of wave arrival time at these stations and direction of wave
arrival, it is possible to estimate the lightning location exciting this wave. As the intense lightning discharges can excite transient luminous events (TLEs),
such as sprites, elves, blue jets, it is possible to monitor global TLE activities by monitoring SR waves.
From the analysis of the long-term SR data, it is found that the spectral amplitude of SR waves changes with the periodicity of 5-day, 10-day, and 27-day. As the periodicity of 27-day is
comparable to the rotation period of the Sun, there may be some relation between the solar activity and the global lightning activity. Our laboratory is conducting
the study to identify the link mechanism between them.
Intensity Prediction of Severe Weather
 The intensity prediction and prediction of occurrence of severe weather, such as tornado, down burst, torrential rain fall, typhoon, etc., is very hard even
though we use very resent weather observation data. One reason for this is that the thunderstorm causing these events rapidly develops within a few tens of minutes and occurs in the
localized region. Although Japan is one of the countries where the weather observation network has well developed, it is hard to detect such thunderstorms with enough spatial and
temporal resolution. Lightning discharges occur at the active thundercloud, which is formed by the intense upward wind. Thus, it is considered that the lightning
activities can be a good proxy to monitor the upward convection. In addition, it is suggested that there must be some relation between the lightning activities and occurrence of
severe weather.
The intensity prediction and prediction of occurrence of severe weather, such as tornado, down burst, torrential rain fall, typhoon, etc., is very hard even
though we use very resent weather observation data. One reason for this is that the thunderstorm causing these events rapidly develops within a few tens of minutes and occurs in the
localized region. Although Japan is one of the countries where the weather observation network has well developed, it is hard to detect such thunderstorms with enough spatial and
temporal resolution. Lightning discharges occur at the active thundercloud, which is formed by the intense upward wind. Thus, it is considered that the lightning
activities can be a good proxy to monitor the upward convection. In addition, it is suggested that there must be some relation between the lightning activities and occurrence of
severe weather.
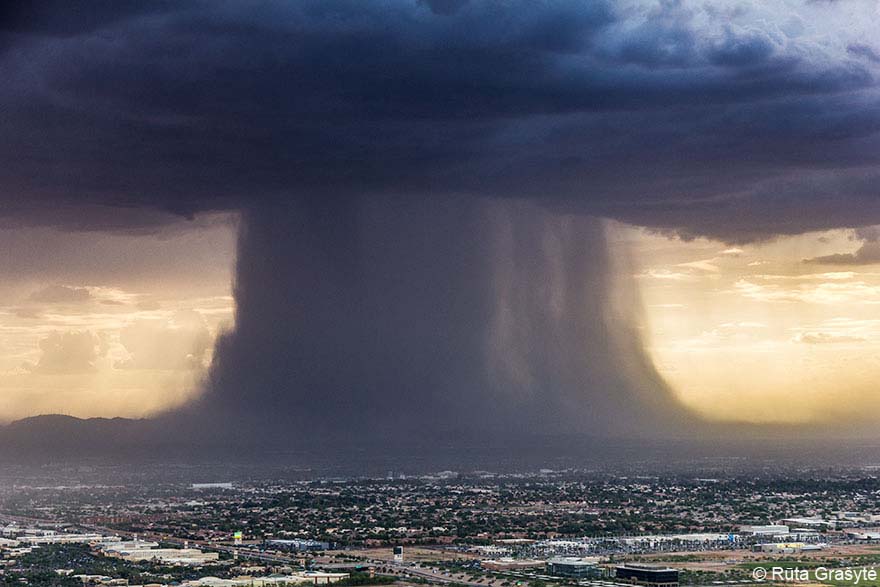
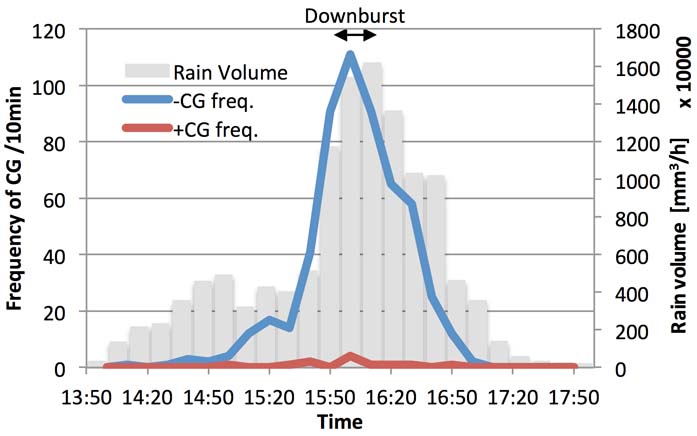 In our laboratory, we are conducting the studies on the relation between the occurrence of down burst and lightning activities and are developing the method to predict the occurrence of
down burst. Right figure is an example showing the lightning activities and rain volume in the down burst event occurred in Takasaki city, Japan. In this figure,
occurrence number of negative cloud-to-ground (-CG) and positive cloud-to-ground (+CG) discharges and rain volume are counted every 10 min and are plotted. As shown in this figure, the
down burst event occurred at 15:50JST. Just before the occurrence of the down burst, the peak of the -CG occurrence number appeared. As similar characteristics can be found in other
down burst events, the monitoring of lightning activities may provide the useful information for the prediction of the down burst occurrence. We are also
conducting the studies on the relation between lightning activities and intensity development of typhoon and torrential rainfall.
In our laboratory, we are conducting the studies on the relation between the occurrence of down burst and lightning activities and are developing the method to predict the occurrence of
down burst. Right figure is an example showing the lightning activities and rain volume in the down burst event occurred in Takasaki city, Japan. In this figure,
occurrence number of negative cloud-to-ground (-CG) and positive cloud-to-ground (+CG) discharges and rain volume are counted every 10 min and are plotted. As shown in this figure, the
down burst event occurred at 15:50JST. Just before the occurrence of the down burst, the peak of the -CG occurrence number appeared. As similar characteristics can be found in other
down burst events, the monitoring of lightning activities may provide the useful information for the prediction of the down burst occurrence. We are also
conducting the studies on the relation between lightning activities and intensity development of typhoon and torrential rainfall.
SATREPS Project
 Recent advances of the ground-based and satellite weather observations and numerical weather model brought the remarkable improvement of the typhoon track prediction. But, the
prediction error of the typhoon intensities (wind speed and pressure) is still high. One reason for this is the difficulty to directly measure the wind speed
and pressure in the typhoon clouds. In contrast, it is reported that the lightning occurrence number within the hurricane cloud (<500 km from the hurricane center) and intensity development
of hurricane are highly correlated [ Price, et al., 2009 ]. It is also reported that the peak of
the lightning activities appears 30-hour before the peak of the hurricane wind speed. This means that we can predict the tomorrow's hurricane intensity if we
monitor today's lightning activities. If this relation exists not only in hurricanes but also in typhoons and if we construct operative lightning observation network in the
western north Pacific region, many countries in Southeast Asia can obtain the cost-effective typhoon observation network.
Recent advances of the ground-based and satellite weather observations and numerical weather model brought the remarkable improvement of the typhoon track prediction. But, the
prediction error of the typhoon intensities (wind speed and pressure) is still high. One reason for this is the difficulty to directly measure the wind speed
and pressure in the typhoon clouds. In contrast, it is reported that the lightning occurrence number within the hurricane cloud (<500 km from the hurricane center) and intensity development
of hurricane are highly correlated [ Price, et al., 2009 ]. It is also reported that the peak of
the lightning activities appears 30-hour before the peak of the hurricane wind speed. This means that we can predict the tomorrow's hurricane intensity if we
monitor today's lightning activities. If this relation exists not only in hurricanes but also in typhoons and if we construct operative lightning observation network in the
western north Pacific region, many countries in Southeast Asia can obtain the cost-effective typhoon observation network.
 The Philippine is one of the countries suffering from the typhoon attacks. Once strong typhoon makes landfall on the Philippines, a tremendous amount of damage can be brought. For example,
typhoon #30 (Haiyan) occurred in November 2013 had developed with the minimum pressure of 895 hPa and with the wind speed of 65 m/s near center and the maximum instantaneous wind
speed of 90 m/s, and it finally made landfall over the Philippine. Due to this typhoon and associated storm surge, ~6,000 people died. Thus, it is very important to predict the intensity
development of typhoons as early as possible in order to reduce the typhoon damage in the Philippines. In addition, the disaster prevention in urban areas is urgent issue, and early
detection of convective cloud and related severe weather is very important in the Philippines.
The Philippine is one of the countries suffering from the typhoon attacks. Once strong typhoon makes landfall on the Philippines, a tremendous amount of damage can be brought. For example,
typhoon #30 (Haiyan) occurred in November 2013 had developed with the minimum pressure of 895 hPa and with the wind speed of 65 m/s near center and the maximum instantaneous wind
speed of 90 m/s, and it finally made landfall over the Philippine. Due to this typhoon and associated storm surge, ~6,000 people died. Thus, it is very important to predict the intensity
development of typhoons as early as possible in order to reduce the typhoon damage in the Philippines. In addition, the disaster prevention in urban areas is urgent issue, and early
detection of convective cloud and related severe weather is very important in the Philippines.
Thus, our laboratory and colleagues in Japan started the project named as ULAT (Understanding Lightning and Thunderstorms) under the scheme of SATREPS (Science
and Technology Research Partnership for Sustainable Development) in 2017. In this project, we will construct operational lightning detection network in the western north Pacific
region in order to predict intensity development of severe weather. This is the joint project with ASTI (Advanced Science and Technology Institute).
More details about this mission: click here
PIRKA Telescope
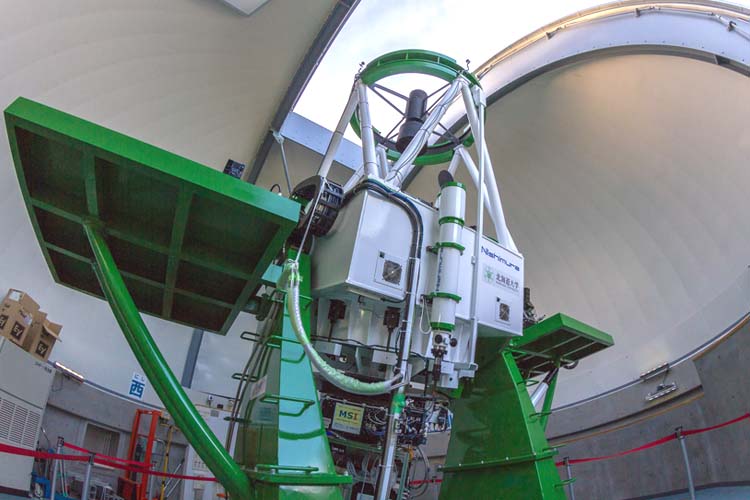 Our laboratory owns the optical telescope named as PIRKA with the effective diameter of 1.6 m. This telescope is installed at Nayoro city, Hokkaido.
Using this telescope, we are mainly conducting the multi-spectral imaging observations of Venus, Mars, Jupiter, Saturn and Uranus. The optical telescope having 1.6 m mirror is one
of the largest telescope in Japan. In addition, Nayoro city locates 100 km north from Asahikawa and 200 km north from Sapporo. As this city keeps fine weather even in the
baiu season, we can conduct unique observations.
Our laboratory owns the optical telescope named as PIRKA with the effective diameter of 1.6 m. This telescope is installed at Nayoro city, Hokkaido.
Using this telescope, we are mainly conducting the multi-spectral imaging observations of Venus, Mars, Jupiter, Saturn and Uranus. The optical telescope having 1.6 m mirror is one
of the largest telescope in Japan. In addition, Nayoro city locates 100 km north from Asahikawa and 200 km north from Sapporo. As this city keeps fine weather even in the
baiu season, we can conduct unique observations.
Our laboratory is conducting the observations of the Venus atmosphere and Jovian atmosphere. As for the Venus observations, we are collaborating with the
AKATSUKI spacecraft observations in order to identify the generation mechanism of the super rotation of the cloud layer at ~60 km. As for the Jupiter observations, we are conducting
the multi-spectral and polarimetric observations of haze and clouds near the polar region and high-speed photometric observations of Jovian lightning. These results will give the feedback
on the future Jupiter mission, JUICE.
More details about PIRKA telescope: click here
Sky condition over Nayoro Observatory: click here